

センサーデータやアクセスログを分析するとき、「30分ごとの集計を出したい」「1時間単位でまとめたい」と思うことって、ありますよね。
GROUP BYに日時カラムをそのまま突っ込んでもレコード単位でバラバラに集計されてしまいます。かといって、アプリ側でループして集計するのも……なんか違う気がしませんか。
実はPostgreSQLには generate_series という便利な関数があって、任意の時間間隔でタイムスタンプの連続値を生成し、それを軸にLEFT JOINで集計するという手法でこの悩みをSQLだけで解決できるようです。
このページではgenerate_seriesを使ったタイムスタンプのグルーピング方法を、実際に動かして確認しながら解説します。
この記事でわかること
- PostgreSQLで任意の時間間隔(10分・30分・1時間など)に時系列データをグルーピングするSQLの書き方
- generate_series 関数の仕組みとタイムスタンプへの活用方法
- データが存在しない時間帯も「0件」として表示する方法(LEFT JOINの活用)
- テーブル作成〜テストデータ挿入〜集計クエリまでの完全な実装例
generate_seriesを使ったグルーピングの基本
考え方の概要
たとえば1日分のアクセスログを30分ごとに集計したい場合、最終的に欲しい結果はこういう形ですよね。
 time_slot | count
-----------+-------
 00:00     |   197
 00:30     |   199
 01:00     |   202
 ...(以下省略)
この「30分刻みの時間軸」を自分で作り出してしまうのが generate_series 関数の役割です。generate_seriesで生成した時間軸を基準にして、実テーブルをLEFT JOINすることでデータが存在しない時間帯も0件として取得できるのがポイントです。
SQLの全体像(テンプレート)
30分間隔でグルーピングする汎用テンプレートです。【 】で囲んだ箇所を自身の環境に合わせて書き換えてください。
SELECT
    to_char(time_table, 'hh24:mi')   AS time_slot
    , count(【対象カラム】)          AS cnt
FROM
    generate_series(
        【開始タイムスタンプ】           -- 例: '2025-11-28 00:00:00'::timestamp
        , 【終了タイムスタンプ】         -- 例: '2025-11-28 23:59:59'::timestamp
        , interval '30 minute'           -- ← ここを変えると間隔が変わる
    ) AS time_table
    LEFT JOIN 【対象テーブル】 ON (
        【対象カラム】 >= time_table
        AND 【対象カラム】 < time_table + interval '30 minute'
    )
GROUP BY
    time_table
ORDER BY
    time_table;
💡 ポイント:LEFT JOINを使う理由 INNER JOINにするとデータが存在しない時間帯の行が消えてしまいます。グラフ化や外部ツールへの連携を想定する場合、0件でも行を出力するためにLEFT JOINを使うのがベターです。
generate_series関数とは
基本的な動作
generate_seriesはstartからstopまでstepの間隔で連続した値を生成する集合返却関数(Set Returning Function)です。タイムスタンプ型にも対応しておりFROM句に置くことで1カラムのテーブルのように扱えます。
generate_series(start, stop, step interval)| 引数 | 型 | 説明 |
|---|---|---|
| start | timestamp / timestamptz | 開始日時 |
| stop | timestamp / timestamptz | 終了日時 |
| step | interval | 刻み幅 |
公式ドキュメントはこちらで確認できます。
PostgreSQL: Documentation – Set Returning Functions
生成されるタイムスタンプのイメージ
30分間隔で ‘2025-11-28 00:00:00’ 〜 ‘2025-11-28 01:30:00’ を指定すると、次のような値が生成されます。
2025-11-28 00:00:00
2025-11-28 00:30:00
2025-11-28 01:00:00
2025-11-28 01:30:00
これを軸にLEFT JOINすると各行にマッチしたレコードが紐付いてきます。
2025-11-28 00:00:00  |  2025-11-28 00:04:00
2025-11-28 00:00:00  |  2025-11-28 00:16:00
2025-11-28 00:00:00  |  2025-11-28 00:29:00
2025-11-28 00:30:00  |  2025-11-28 00:35:00
2025-11-28 00:30:00  |  2025-11-28 00:51:00
2025-11-28 01:00:00  |  2025-11-28 01:00:00
...
これを time_table でGROUP BY&COUNTすれば30分ごとの件数が出来上がりです。
間隔を変えるだけで柔軟に対応できる
interval の値を変えるだけでさまざまな集計粒度に対応できます。
| 集計粒度 | intervalの記述例 |
|---|---|
| 10分ごと | interval '10 minute' |
| 15分ごと | interval '15 minute' |
| 30分ごと | interval '30 minute' |
| 1時間ごと | interval '1 hour' |
| 1日ごと | interval '1 day' |
実際にやってみる
アクセスログを想定したテーブルを作成し、テストデータを入れて集計クエリを実行してみます。
Step 1:テーブルを作成する
1日分のアクセス数を30分ごとに集計するパターンで試してみます。タイムスタンプだけでも良かったのですが、せっかくなのでアクセスログっぽい感じでユーザー名も入れてみました。
CREATE TABLE access_log (
    id          BIGSERIAL
    , user_name VARCHAR(255)
    , access_time TIMESTAMP
);
-- 実行結果
CREATE TABLE
Step 2:テストデータを10,000件作成する
1分単位のランダムなタイムスタンプを1万件ほど作成します。ユーザー名はとりあえず md5 でテキトーな文字列を入れています。余計なものを入れるからこうなる……
INSERT INTO access_log (user_name, access_time)
SELECT
    md5(clock_timestamp()::TEXT)
    , date_trunc('day', now()) + trunc(random() * 60 * 24) * interval '1 minute'
FROM
    generate_series(1, 10000);
-- 実行結果
INSERT 0 10000
10件ほど確認してみると、分単位のランダムなタイムスタンプになっていることが確認できます。
SELECT * FROM access_log LIMIT 10;
 id |             user_name            |     access_time
----+----------------------------------+---------------------
  1 | a02f0a047a994ee920cfdb7940cecef8 | 2025-11-28 03:41:00
  2 | bb46b16afc0737f4aeb6565d8b556474 | 2025-11-28 05:21:00
  3 | 9e60031d328a3cf28321f8425a6e7142 | 2025-11-28 13:20:00
  4 | 927c172e60ca72524f7990e43b0b332e | 2025-11-28 15:32:00
  5 | e5e03ff6319232121ae27af22a3e7828 | 2025-11-28 20:25:00
  6 | fbd4c4d1b34aa66311fd40a38ecbca5c | 2025-11-28 05:07:00
  7 | 0a0ac15ac15790d15246cfdb5a1d03e4 | 2025-11-28 16:39:00
  8 | c981fa58ced8d1187c2a3821e9e2375e | 2025-11-28 00:54:00
  9 | c27e463b24d6296afcd3ae08071823b0 | 2025-11-28 09:02:00
 10 | fb102f549419560de544a7ace61935cc | 2025-11-28 11:32:00
Step 3:30分ごとの件数を集計する
当日1日分を30分ごとに集計するクエリを実行します。date_trunc(‘day’, now()) で今日の00:00:00を動的に取得しているので、日付をハードコードしなくて済みます。
SELECT
to_char(time_table, 'hh24:mi') AS time_slot
, count(access_log.access_time) AS cnt
FROM
generate_series(
date_trunc('day', now())
, date_trunc('day', now()) + interval '23 hour 59 minute 59 second'
, interval '30 minute'
) AS time_table
LEFT JOIN access_log ON (
access_log.access_time >= time_table
AND access_log.access_time < time_table + interval '30 minute'
)
GROUP BY
time_table
ORDER BY
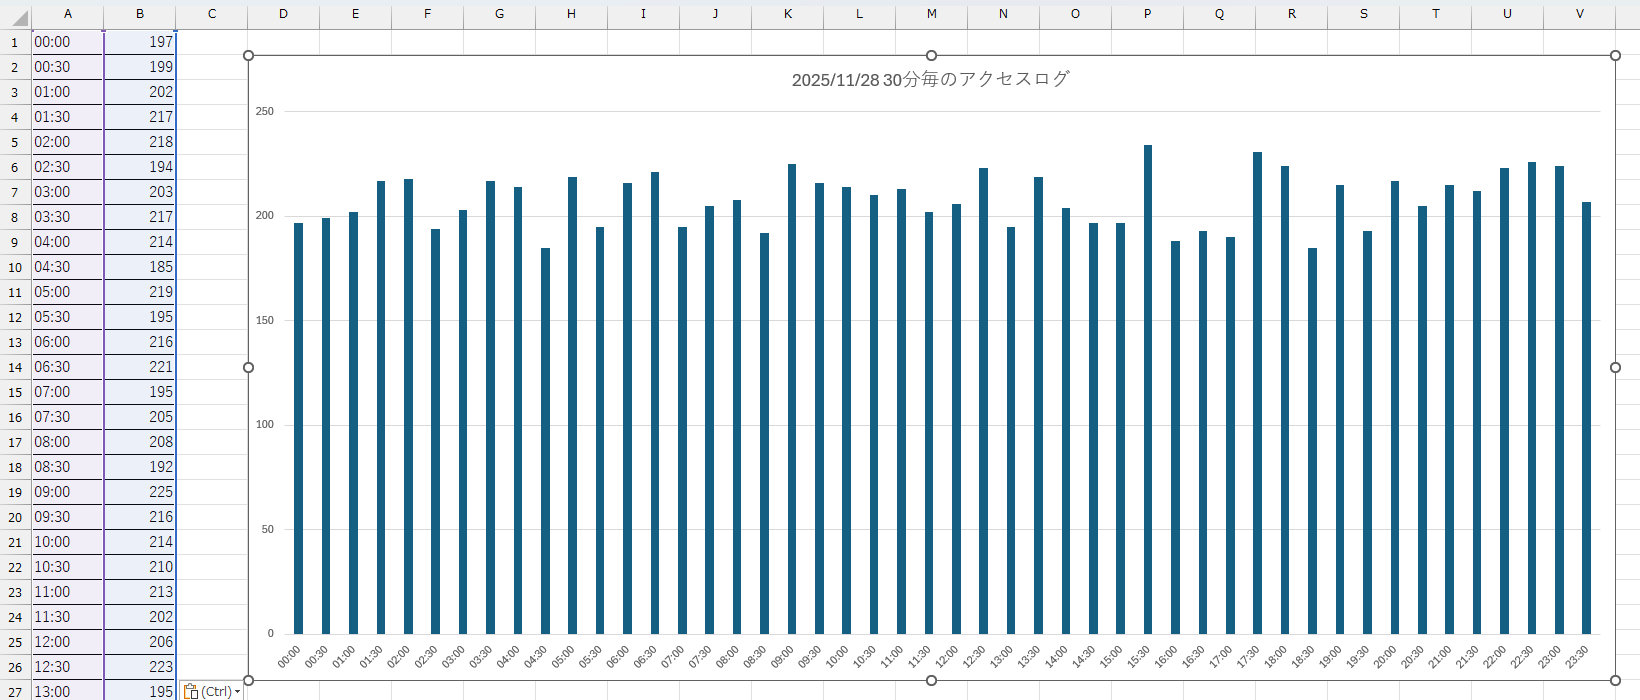
time_table;実行結果はこんな感じになります。
 time_slot | cnt
-----------+-----
 00:00     | 197
 00:30     | 199
 01:00     | 202
 01:30     | 217
 02:00     | 218
 ...(中略)
 23:00     | 224
 23:30     | 207
これをそのままExcelに貼り付けると、ワンクリックでグラフ化できますよ!
Q&A
- Q特定の日付範囲を指定したい
- A
date_trunc(‘day’, now()) の部分をリテラルのタイムスタンプに変えるだけでOKです。
SQLgenerate_series( '2025-11-01 00:00:00'::timestamp , '2025-11-01 23:59:59'::timestamp , interval '30 minute' )
- Qtimestamp with time zone(timestamptz)でも使える?
- A
使えます。generate_series はタイムスタンプ型・タイムゾーン付きタイムスタンプ型の両方をサポートしています。引数とテーブルのカラムの型を合わせておくと、暗黙的な型変換によるインデックスの効き方への影響を避けられます。
- Q大量データで実行速度が遅い場合の対策は?
- A
access_time カラムにインデックスを張るとJOINのパフォーマンスが大幅に改善します。
SQLCREATE INDEX idx_access_log_access_time ON access_log (access_time);また、集計対象の期間が広い場合はパーティショニングも検討してみてください。
まとめ
- generate_series でタイムスタンプの連続値を生成して、それを軸にLEFT JOINすることで任意の時間間隔での集計が実現できるよ。
- interval の値を変えるだけで10分・30分・1時間など粒度を自由に切り替えできるので使い回しがきいて便利だよ。
- LEFT JOINを使うことでデータが存在しない時間帯も0件として出力されるのがうれしいポイント。
date_trunc('day', now())で動的に今日の開始日時を取得するようにしておくと日付のハードコードを避けられてスマートだよ。- 集計結果はそのままExcelに貼り付けてグラフ化できるから、報告資料づくりにも直結してくれるのが個人的にお気に入り。